DMARC stands for “Domain-based Message Authentication, Reporting and Conformance”. It is as protocol for email authentication, policy and reporting. It based on SPF and DKIM protocol which are widely used by email providers and mail server operators to authenticate and verify emails.
DMARC links sender authentication checks and receipient handling in case of authentication failures. Furthermore it adds reporting from receivers to senders to provide a facility to monitor and control the email protection.
Deploy DMARC for your domain
DMARC policy lets you configure to indicate that your domain is protected by SPF and DKIM.
You need to publish a TXT resource record for the domain in your DNS zone. This resource record helps you to control what happens if SPF or DKIM fails.
. TXT "v=DMARC1; p=reject; sp=reject; pct=100; rua=mailto:postmaster@example.com"Following you find a list of all parameters available for configuring DMARC.
monitoring and visualisation with parsedmarc
The reports are sent to the email addresses configured in ruf and rua parameters in DMARC TXT resource record in xml format.
Example for aggregated DMARC report
1
2
3
4
5
6
7
8
9
10
11
12
13
14
15
16
17
18
19
20
21
22
23
24
25
26
27
28
29
30
31
32
33
34
35
36
37
38
39
40
41
42
43
44
45
46
<?xml version="1.0" encoding="UTF-8" ?>
<feedback>
  <report_metadata>
    <org_name>google.com</org_name>
    <email>noreply-dmarc-support@google.com</email>
    <extra_contact_info>https://support.google.com/a/answer/2466580</extra_contact_info>
    <report_id>17267560027217318633</report_id>
    <date_range>
      <begin>1645574400</begin>
      <end>1645660799</end>
    </date_range>
  </report_metadata>
  <policy_published>
    <domain>example.com</domain>
    <adkim>r</adkim>
    <aspf>r</aspf>
    <p>reject</p>
    <sp>reject</sp>
    <pct>100</pct>
  </policy_published>
  <record>
    <row>
      <source_ip>209.85.220.69</source_ip>
      <count>1</count>
      <policy_evaluated>
        <disposition>none</disposition>
        <dkim>pass</dkim>
        <spf>pass</spf>
      </policy_evaluated>
    </row>
    <identifiers>
      <header_from>example.com</header_from>
    </identifiers>
    <auth_results>
      <dkim>
        <domain>example.com</domain>
        <result>pass</result>
        <selector>default</selector>
      </dkim>
      <spf>
        <domain>example.com</domain>
        <result>pass</result>
      </spf>
    </auth_results>
  </record>
</feedback>
For visualisation and monitoring there are some popular commercial tools outside. Some of them are:
It is absolutly fine to use one of these tools but if you are not willing to use a commercial tool and you have some time and knowledge you can setup a free toolchain as your DMARC monitoring tool.
This is where parsedmarc comes into play. It is a simple python library which can be used to parse DMARC reports and visualize them.
Setup
Installation of parsedmard is done with pip as any other python library. We don’t want to cover this here but we want to show how to setup the whole toolchain.
In our example we use IMAP to grap DMARC reports, send the extracted data to elasticsearch and visualize the data with kibana.
configure elasticsearch
As we use elasticsearch as our monitoring backend and our elasticsearch cluster needs authentication we need to create a role and a user for that user.
For that we use the following json snippets send to the corresponding RestAPI endpoint of elasticsearch.
POST /_security/role/parsedmarc
1
2
3
4
5
6
7
8
9
10
11
12
13
14
15
16
17
18
19
{
  "cluster": [ ],
  "indices": [
    {
      "names": [
        "dmarc_aggregate*",
        "dmarc_forensic*"
      ],
      "privileges": [
          "read",
          "write",
          "view_index_metadata",
          "create",
          "delete",
          "create_index"
      ]
    }
  ]
}
POST /_security/user/dmarcingest
1
2
3
4
5
{
  "password" : "dm4rcp455w0rd",
  "roles" : [ "parsedmarc"],
  "full_name" : "User for Ingesting DMARC information"
}
Note: As an alternative to the RestAPI you can use kibana’s role and user management feature.
parsedmarc config file
Now we have to create a config file with the following content.
parsedmarc.ini
1
2
3
4
5
6
7
8
9
10
11
12
13
14
15
16
[general]
save_aggregate = True
save_forensic = True

[imap]
host = imap.example.com
user = imapuser
password = v3ryS3cr3t
ssl = true
reports_folder = my/imap/folder
watch = True

[elasticsearch]
hosts = https://dmarcingest:dm4rcp455w0rd.@elastic.example.com:9200
cert_path = /etc/parsedmarc/elastic_ca.crt
ssl = True
As we want to run parsedmarc as systemd service we put all files belongs to parsedmarc in a directory called /etc/parsedmarc.
In this directory we also place the ca certificate for the elasticsearch connection.
With this configuration you are already able to run parsedmarc to import report data into elasticsearch.
# parsedmarc -c /etc/parsedmarc/parsedmarc.ini
This starts a parsedmarc mailbox listener and imports the reports into elasticsearch.
configure kibana
We suggest to create a separate kibana space for the DMARC.
And we alos can create a role and user to only have read-only access to the space to view DMARC dashboards.
POST _security/role/parsedmarc_viewer
1
2
3
4
5
6
7
8
9
10
11
12
13
14
15
16
17
18
19
20
21
22
23
24
25
26
27
28
29
{
  "cluster": [],
  "indices": [
    {
      "names": [
        "dmarc_forensic*",
        "dmarc_aggregate*",
        "parsedmarc"
      ],
      "privileges": [
        "read",
        "view_index_metadata"
      ],
      "allow_restricted_indices": false
    }
  ],
  "applications": [
    {
      "application": "kibana-.kibana",
      "privileges": [
        "feature_dashboard.read"
      ],
      "resources": [
        "space:dmarc"
      ]
    }
  ],
}
}
POST /_security/user/parsedmarc_viewer
1
2
3
4
5
{
  "password" : "v3ryS3cr3t",
  "roles" : [ "parsedmarc_viewer"],
  "full_name" : "User for viewing DMARC dashboards"
}
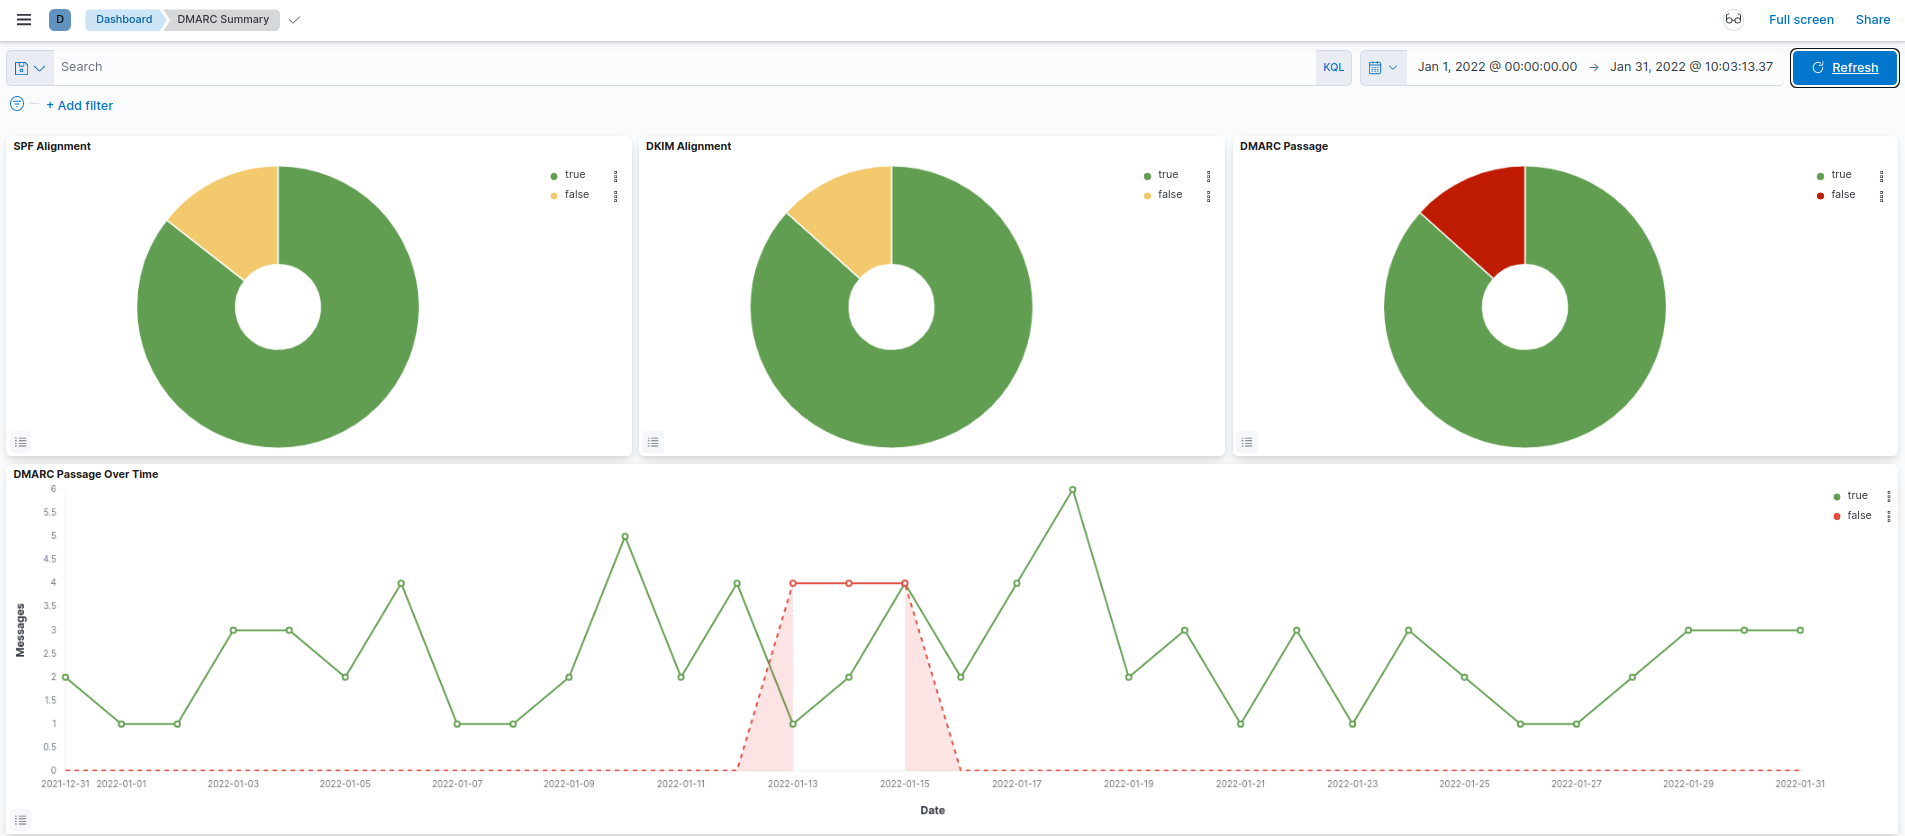
dashboards and index patterns
To visualize the data we need to create dashboards and index patterns. This is done by importing the export.ndjson (use the save link as option) file. This file contains two dashboards and two index patterns.
This task id done by using the Saved Objects UI.
Note: If you create a separate space for your DMARC work you have to import the dashboards and index patterns into that space.
running parssedmarc as systemd service
As for now we have setup elasticsearch, kibana and parsedmarc to import data and visualize it. As for now we have to start the parsedmarc service manually. This is not very convinient so we go ahead and setup systemd service.
First of all we want to run the service with non-root privileges so we need to create a user and a group. And we also want to restrict the access to parsedmarc configuration directory to that user and group.
groupadd -r parsedmarc
useradd -rL parsedmarc -g parsedmarc
chown -R parsedmarc:parsedmarc /etc/parsedmarc
chmod -R 750 /etc/parsedmarc
As we already have save our parsedmarc.ini and elastic_ca.crt files we now need to create a systemd unit file with the following content.
/etc/systemd/system/parsedmarc.service
1
2
3
4
5
6
7
8
9
10
11
12
13
14
15
[Unit]
Description=parsedmarc mailbox watcher
Documentation=https://domainaware.github.io/parsedmarc/
Wants=network-online.target
After=network.target network-online.target elasticsearch.service

[Service]
ExecStart=/usr/local/bin/parsedmarc -c /etc/parsedmarc/parsedmarc.ini
User=parsedmarc
Group=parsedmarc
Restart=always
RestartSec=5m

[Install]
WantedBy=multi-user.target
With this configuration we are ready to enable and start the parsedmarc service as follows.
systemctl daemon-reload
systemctl enable parsedmarc.service
service parsedmarc start
Conclusion
DMARC is a very useful protocol to indicate that your mail server is protected against spam and phishing by spf and dkim and it implements a policy what should happen if a mail is not compliant with the policy.
It also implements a facility to get reports of the dmarc results via email in a common xml formant.
To monitor the dmarc compliance you can choose a commercial solution but you can also use free software to implement a visualisation stack on your own. We show you how to setup eleasticsearch, kibana and parsedmarc to achieve this.
Now you should be able to monitor the success of your dmarc setup. We hope that you find this tutorial helpful and that you can use it to implement your own dmarc solution.